Demand forecasting software
Demand forecasting software that shows what is likely to sell before you decide what to buy.
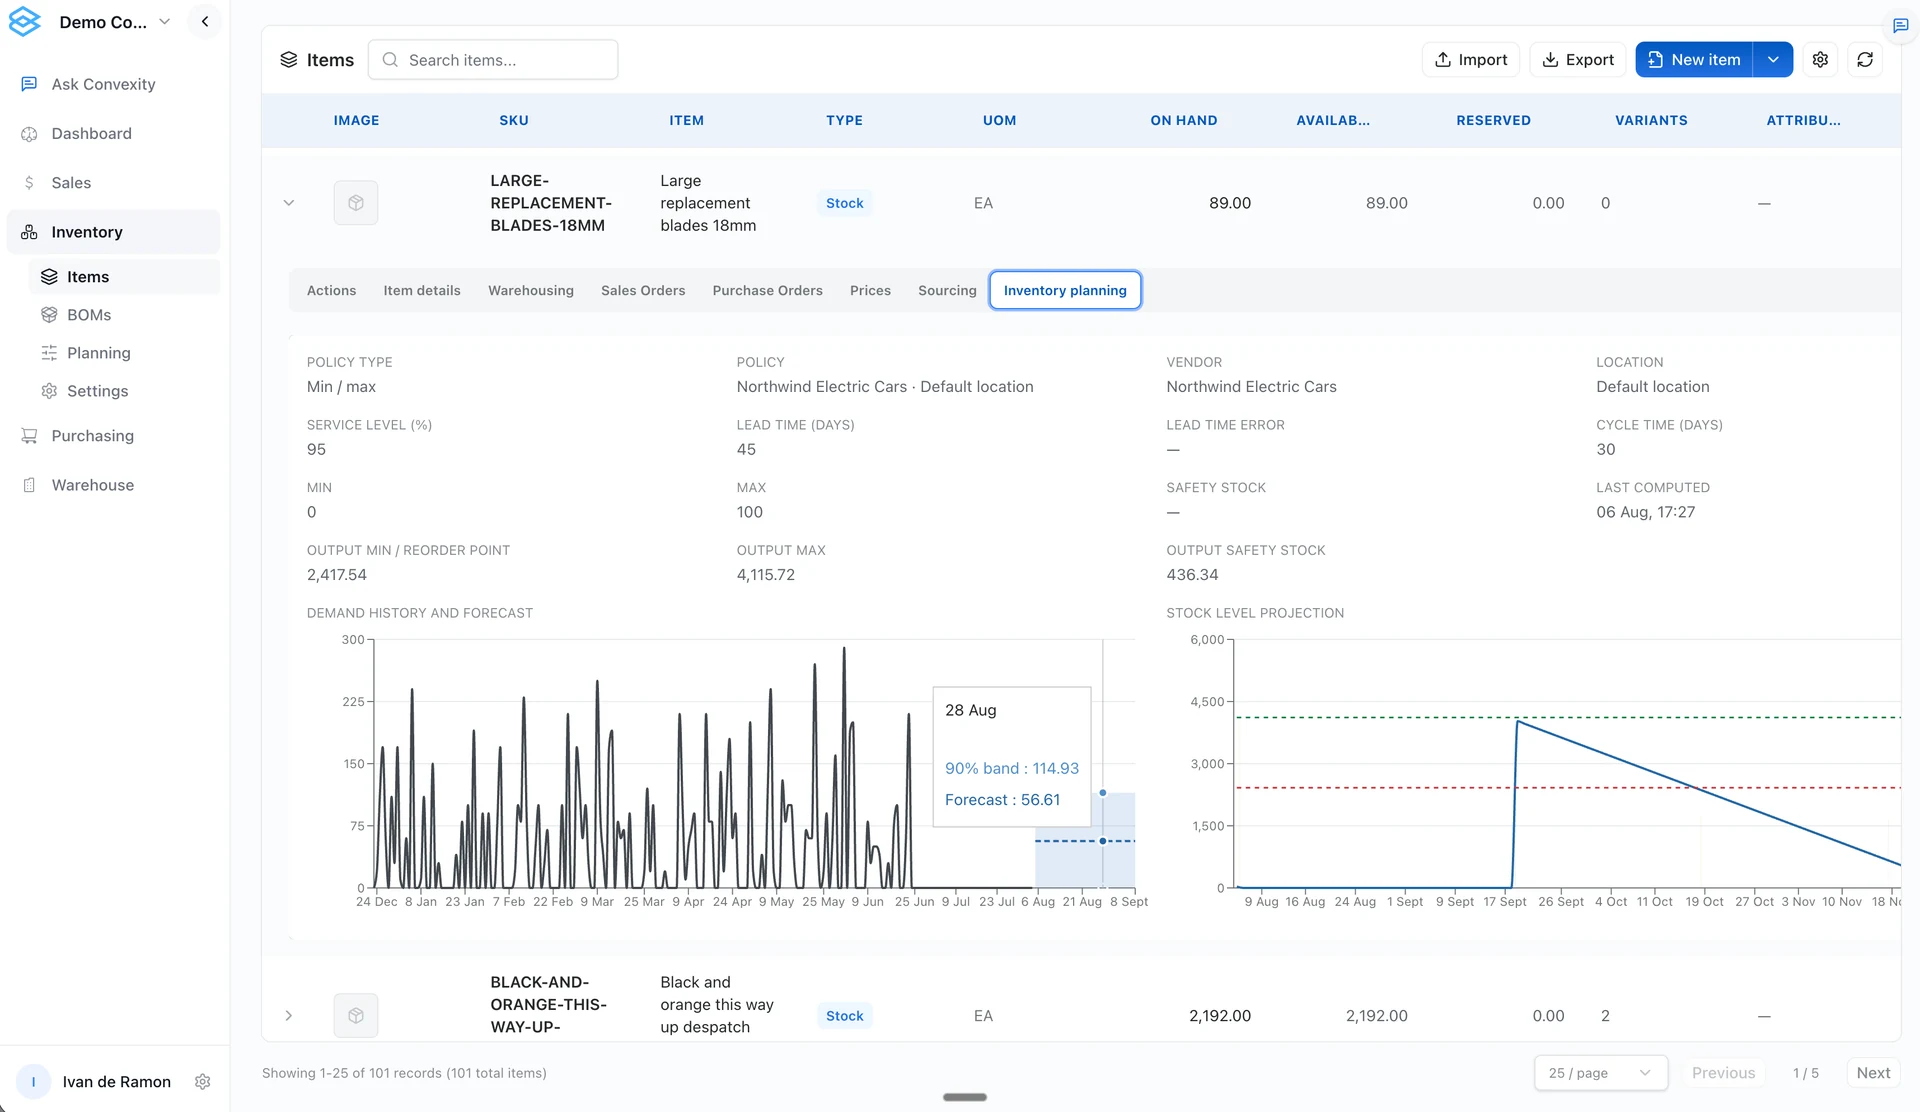
Demand forecasting software for distributors and wholesalers: SKU-level forecasts that connect sales history, stock and purchasing decisions.
Forecast demand for each SKU
A purchasing team needs more than a total sales forecast. It needs to see which items are moving, which have gone quiet, and where lower sales may come from missing stock. Convexity brings item-level forecasts and inventory analysis into the purchasing workflow.
What goes into a useful forecast?
Historical sales by SKU and date, with consistent item identifiers.
Current stock and item status, so active and inactive products are read correctly.
Seasonal patterns and known changes that your planners can explain.
The buying horizon and supplier lead times that turn a forecast into a purchasing decision.
New products, infrequent sales and out-of-stock periods need extra attention. Review these exceptions with your planner. Do not treat every forecast as equally reliable.
How forecasting supports purchasing
Connect and check the history
Map sales and inventory records from the agreed source. Check SKU matches, date coverage, missing periods and refresh frequency. Do this before you rely on the model.
Review the item-level forecast
Compare expected demand with historical sales and stock levels. Use Ask Convexity to explore the underlying data and investigate changes.
Translate demand into a buy decision
Review the forecast with available stock, incoming purchases, supplier lead times and buying constraints. Inventory optimization turns this context into suggested stock levels and purchase quantities.
Compare sales history with the forecast
Review revenue, gross profit and units sold over time to see the business trend. Then open item-level planning to compare historical demand with a forecast. A sales dashboard shows what happened. The forecast helps you plan what comes next.
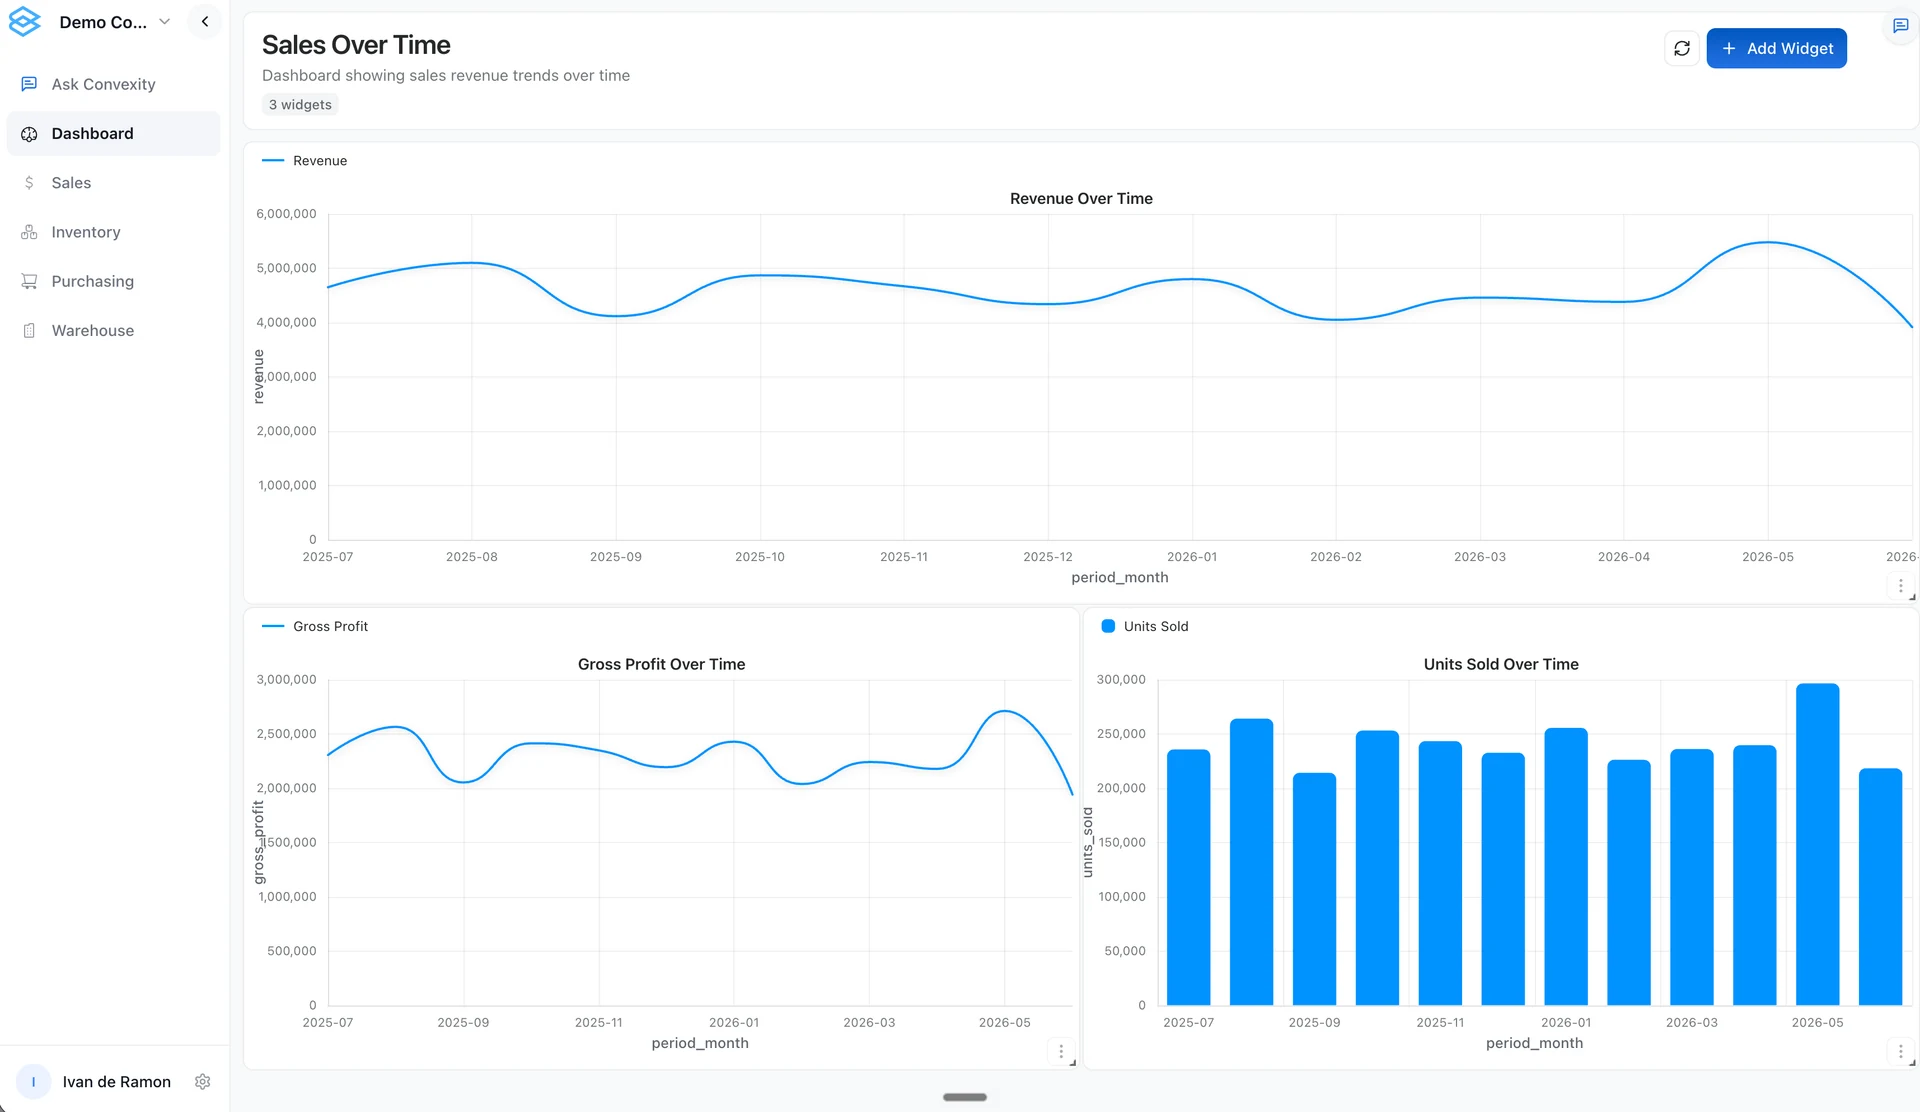
Example: finding products worth restocking
For a distributor with a changing catalog, a useful question is which out-of-stock or inactive items have a sales history worth reviewing. The planner compares that history with current availability and supplier options. Then they decide whether to buy again. Past sales alone do not prove future demand.
Test the forecast before you rely on it
Test the forecast against sales from a period the model has not seen. Compare it with your current method. Review fast sellers, slow movers and stockout periods separately. Track purchasing results as well as forecast accuracy.
What your team can review
SKU-level demand forecasts next to historical sales.
Inventory context for investigating possible shortages or excess stock.
The data behind a purchasing recommendation, with questions handled through Ask Convexity.
Exceptions where a planner must add business context or fix the input data.
A forecast is a planning estimate, not a guaranteed sales result. Agree how to check accuracy and data freshness before you commit purchasing spend.
Bring a sample sales-history export and a few hard-to-plan SKUs. We will review the data and show how forecasting connects to a purchasing decision.
Book a demoFrequently asked questions
Start with your workflow
Bring one inventory, purchasing or order-management problem. We will map the required data, demonstrate the relevant workflow and identify what needs configuration or further validation.
Book a demo